
To help Council Candidates and Voters better understand cycling policy and infrastructure project priorities, Bike Winnipeg has put together a number of policy and infrastructure recommendations that we hope can be moved forward in the next term of council.
Adopt Policies to Get More People Walking and Cycling
Adopt a Vision Zero Policy
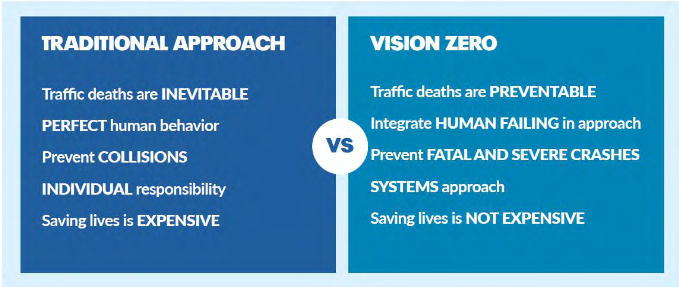
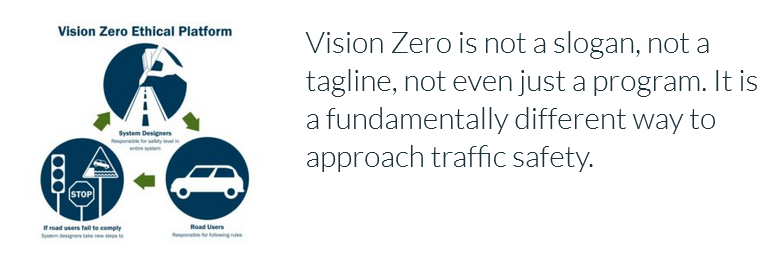
Vision Zero began as a Swedish road safety initiative in 1997. It can be summarized in one sentence: No loss of life is acceptable. Human life and health are paramount values and can never be exchanged for other benefits within the society. This approach recognizes that human mistakes are inevitable so this is taken into account when designing the road transport system. To prevent deaths and serious injuries, it focuses on traffic systems, placing more responsibility for safety on system design, management and leadership. In every situation a person might fail; the road system should not.
Principles for Vision Zero include:
- Traffic deaths and injuries are preventable; therefore, none are acceptable.
- Human life and health take priority over mobility and other objectives of the road traffic system so safety is the primary consideration in transportation decision-making.
- People will make mistakes; the transportation system should be designed so those mistakes aren’t fatal.
- Providers and regulators of the road traffic system share responsibility with road users;
- Traffic safety solutions must be addressed holistically: providers, regulators and road users must all be ready to change to achieve safety.
Solutions include:
- Vehicle technology -a key part of road safety reducing deaths and injuries
- Traffic control and Surveillance – safety information and intelligent traffic systems
- Infrastructure – making mobility safe from the start involves planning, designing and building (or modifying) roads and infrastructure to increase safety and reduce fatal accidents
- Education and Training – providing safety through education and planning
When Vision Zero was first launched, Sweden recorded seven traffic fatalities per 100,000 people; by 2014, despite a significant increase in traffic volume, that number was fewer than three. This suggests that safety need not compromise mobility.
Across the globe, many countries have embraced its principles and adopted their own version of Vision Zero. In Canada, in 2015 Edmonton announced it was the first Canadian municipality to adopt a ‘Vision Zero’ strategy. In June 2016 Toronto responded to criticisms of its Road Safety Plan by setting a goal of zero deaths within five years instead of the previous 20% reduction in 10 years. At a provincial level, British Columbia, in line with the Vision Zero movement, has set a goal to have the safest roads in North America by 2020 with the ultimate goal to eliminate motor vehicle crash fatalities and serious injuries.
More Information
- Vision Zero Network
- Vision Zero Canada
- Why Sweden has so few road deaths. February 2014
- Moving to Vision Zero: Road Safety Strategy Update and Showcase of Innovation in British Columbia , 2016
- Toronto mayor vows quicker action on road safety after intense criticism, June 2016
- Vision Zero: Traffic Safety by Sweden Accessed July 2016
- The City of Edmonton: About Vision Zero
Improve Accommodation of People on Foot & Bikes During Construction Work
Include New or Improved Walking & Cycling Connections in Developer Agreements
Maintain Our Walking and Cycling Networks Year Round
Maintain Winnipeg's Walking & Cycling Networks in Winter
Reinstate Fall Street Sweeping
Prioritize Line Painting on Streets with Bike Lanes
Fund the Development of Winnipeg’s Walking and Cycling Network
Make Development of the Walking & Cycling Networks a Federal Funding Priority
Although the city has made considerable effort to increase funding for the pedestrian and cycling networks, forecast spending remains too low to complete the basic pedestrian and cycling networks within the 20 year time frame called for in the Pedestrian and Cycling Strategies.
The current budget of $5.4 million/year[1] amounts to less than 40% of the $14 million/year recommended in the Pedestrian and Cycling Strategies[2]. This funding shortfall is being met to some degree by an increased inclusion of walking and cycling infrastructure within other roadway projects. While the walking and cycling facilities included in these roadway projects are welcome additions, they often do not connect to existing walking or cycling infrastructure, and do not necessarily represent the priorities identified for development of the city’s walking and cycling networks.
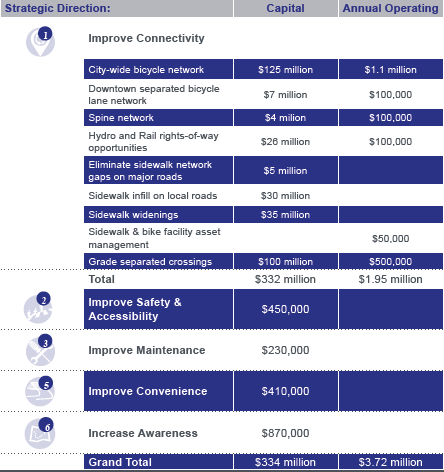
To address this shortfall, we are recommending annual increases to the walking and cycling program of $.667M/year over the next five years, starting in 2019 with the expectation that this increase will be matched by the two senior levels of government to provide an annual increase of $2 million/year. To access provincial and federal funding, the city should highlight the strong co-benefits that higher rates of walking, cycling, and transit use provide, including health benefits, reduced greenhouse gas emissions, economic impacts, reduced congestion, and workforce productivity benefits.
Given that both the Public Transit and Green Infrastructure streams of the Federal Government’s Investing in Canada plan aim to promote active transportation[3], we have a golden opportunity to enter into a cost sharing agreement with the Federal Government to accelerate the development of our walking and cycling networks.
To access Federal and Provincial funding, we are recommending that the next mayor and council direct the Public Works Department to create a package of walking and cycling infrastructure priority projects worth more than $100 Million dollars and make this package of walking and cycling improvements a top priority for the next round of funding from the Investing in Canada Plan.
Focus Spending Downtown and in Disadvantaged Neighbourhoods
With limited funding available to design and develop infrastructure that will make it more comfortable and convenient to walk, bike, or bus to destinations, it is important to ensure that projects to improve walking and cycling infrastructure are focused on areas of the city that have the highest potential to encourage more trips by foot, bike or bus. It is also important to consider areas of the city where limited access to walking or cycling facilities is compounded by socio-economic challenges. In Winnipeg, the areas most likely to attract new users are the downtown and surrounding mature neighbourhoods where density is higher and the existing street network forms a connective grid.
Summary of Recommendations
- Commit to annual increases of $.667M/year for the walking and cycling program budget over the next five years with the expectation that this increase will be matched by the provincial and federal governments to provide an annual increase of $2 million/year in 2019, growing to $10 million/year by 2023.
- Commit direct the Public Works Department to create a package of walking and cycling infrastructure priority projects worth more than $100 Million and to making package of projects a top priority for the next round of funding from the Investing in Canada Plan.
- Focus funding on the Downtown and in Disadvantaged Neighbourhoods
Further Reading
Imagine a Winnipeg… Alternative Municipal Budget Winnipeg 2018 (pdf)
Investing in Canada: Canada’s Long-Term Infrastructure Plan (pdf)
End Notes
[1] Page 2–1, Adopted Capital Budget, City of Winnipeg, 2017
[2] Pages 314–315. Winnipeg Pedestrian and Cycling Strategies, City of Winnipeg, 2015
[3] Page 32, Investing in Canada: Canada’s Long-Term Infrastructure Plan, Government of Canada, 2018
Increase Funding for Regional & Local Streets Sidewalk Renewals
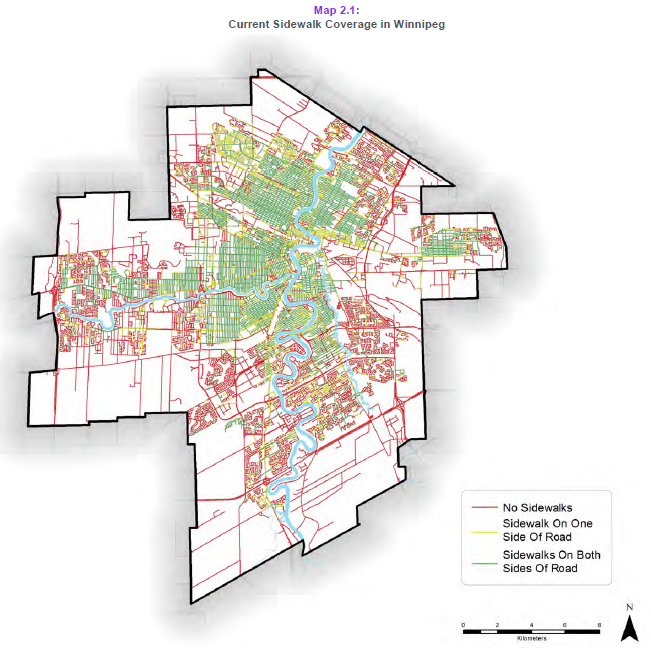
The Local and Regional Street Renewal Programs fund general maintenance and rehabilitation/reconstruction of the city’s local and regional streets and sidewalks. Most of the funding in the Local and Regional Street Renewal Programs is allocated to rehabilitation or reconstruction of local and regional streets. Streets are selected for renewal based on condition of the roadway. When a street (or street segment) is renewed, any sidewalks along that street or street segment are also renewed.
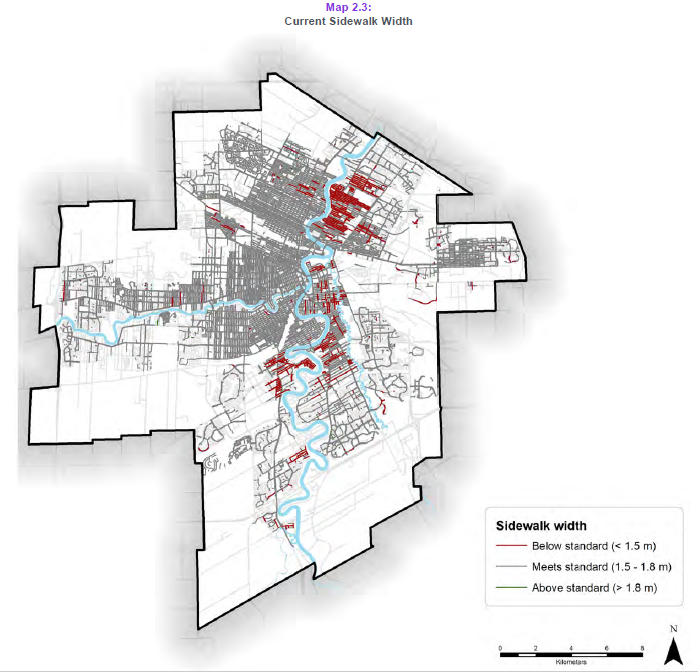
A small part of the streets renewal program is set aside for repair of sidewalks outside of a street renewal. This extra funding for sidewalk renewals might be used to fix a sidewalk that has deteriorated faster than its adjoining street, or to bring a substandard sidewalk up to current standards to ensure it meets the needs of all users. The Pedestrian and Cycling Strategies mapped out the city’s current sidewalks and identified where sidewalks were either missing or substandard.
In 2013 and 2014, the city set up reserve funds financed by annual property tax increases to accelerate the renewal of local and regional streets and sidewalks. These reserve funds have allowed the city to greatly increase the amount of money it spends each year on rehabilitation and reconstruction of local and regional streets.
For instance, between 2008 and 2012, the city spent an average of $39.2 million on Local and Regional Street Renewals. With the introduction of the reserve funds, funding increased to $50.4 million in 2013 and to $84.2 million in 2014.
While funding for regional and local street renewal programs has continued to increase since 2013 and will continue to increase to 2024 and beyond, funding for sidewalk renewals on regional streets has remained stagnant at $500,000 per year, while funding for sidewalk renewals increased from $400,000 per year to $800,000 per year in 2015, but has not increased since.
With adoption of the Revised Accelerated Regional Street Renewal for Federal Funding program on September 20th, funding for local and regional street renewals will continue to grow, but funding for sidewalk renewals will remain unchanged.
Accounting for 2.44% of the local and regional street renewals program in 2006, funding for local and regional sidewalk renewals will amount to just 1.01% of program funding in 2019, and will have dropped to just 0.73% of the programs funding by 2024.
We recommend that beginning in 2019 budgets for sidewalk renewal and within the Local & Regional Street Renewals program be doubled, and that the amount allocated to street renewal projects be dropped by a corresponding amount for a net change of zero in the total funding allocated to the Local and Regional Street Renewals Program.
Create a Pedestrian & Cycling Program Crossing Reserve
Adopt & Fund a Monitoring Program to Focus Investments
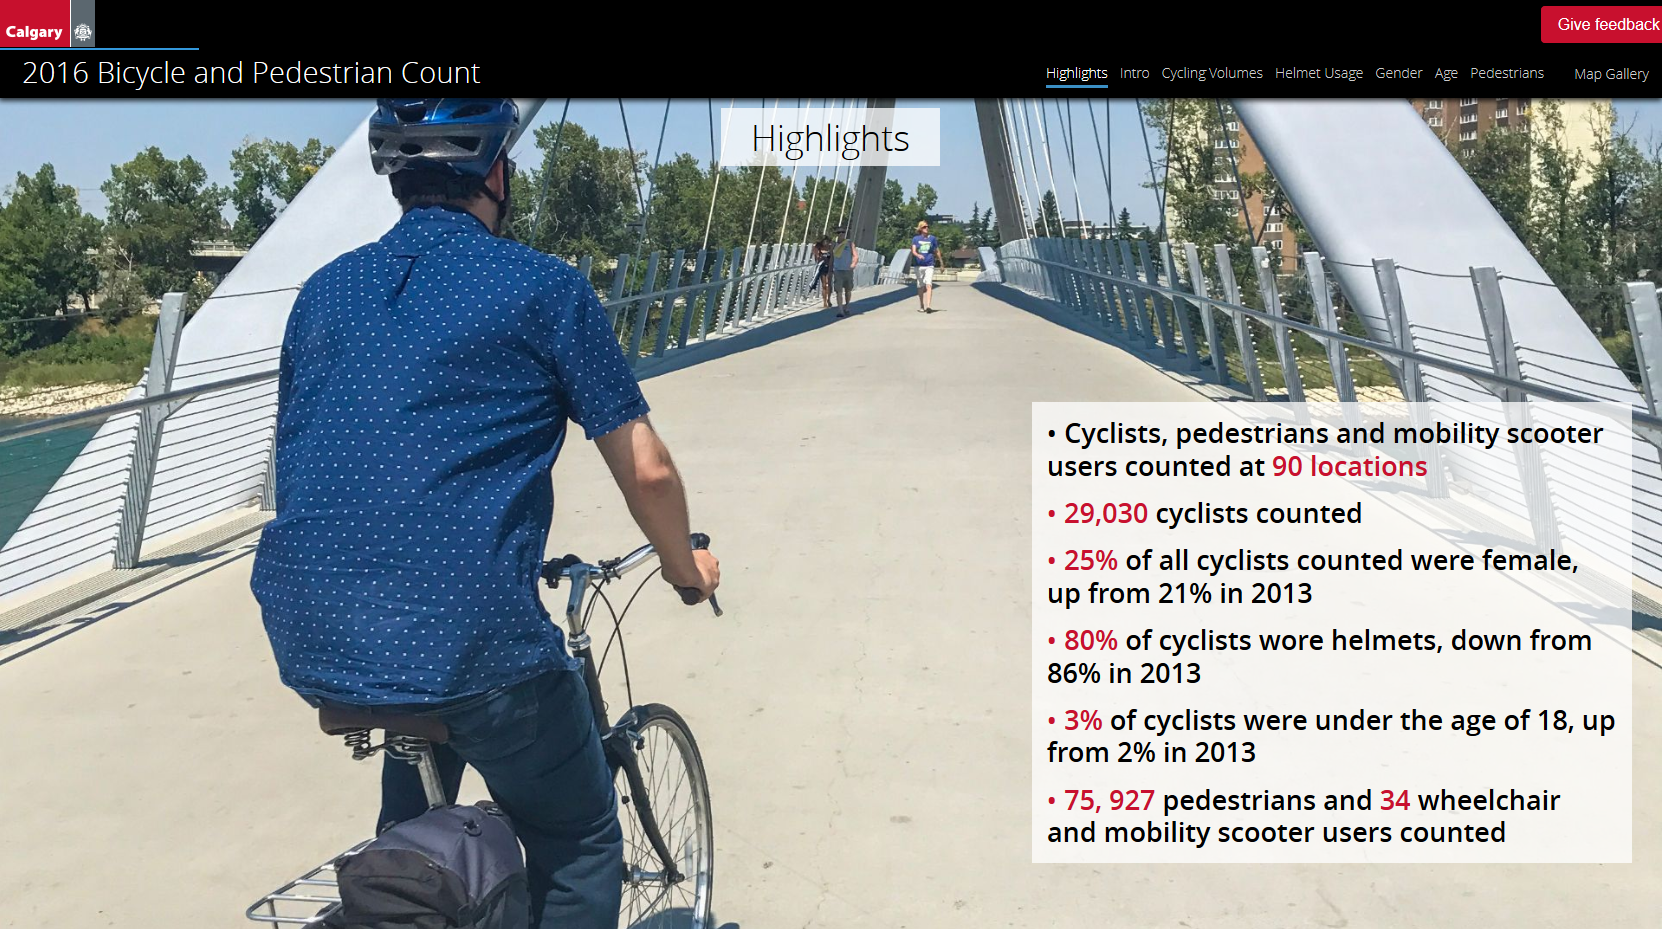
As the city moves forward with implementation of the Pedestrian and Cycling Strategies and its Climate Action Plan, a monitoring strategy that counts how many people are walking or biking along our sidewalks, roads, and pathways is needed to ensure that the strategies are being implemented as intended, and to determine whether the plan is achieving its goals. In addition, a monitoring program may be required to access provincial and federal funding aimed at reducing greenhouse gas emissions.
In April of 2017 the Public Works Department submitted a report to the Standing Policy Committee on Infrastructure Renewal and Public Works outlining a strategy for monitoring pedestrian and cyclist traffic and reporting on the city’s progress towards the goals set out in the Pedestrian and Cycling Strategies.The report notes that the 207 Pedestrian and Cycling Monitoring Program was only partially funded by the 2017 Pedestrian and Cycling Program capital budget ($50,000) and was approved for one year only. An operating budget of $80,000 is recommended to ensure continued operation of the monitoring program.
We are suggesting an annual budget of $80,000 per year for the collection of pedestrian and cyclist traffic data and production of an annual pedestrian and cycling account/annual report, to be taken out of the $250,000 annual budget for the Transportation Master Plan.
More Information
Pedestrian and Cycling Monitoring Program – Public Works Department Report
- City of Calgary Bike Data Portal & Annual Report Cards
- City of Vancouver: Walking and Cycling in Vancouver: 2016 Report Card
Get More People Walking and Cycling
Establish a Targeted Marketing/Individualized Marketing Campaign
Providing new infrastructure and new or improved services is a proven way to increase the number people walking, biking, or taking transit for their day to day travel, but new infrastructure or services shouldn’t be considered as standalone investments. To gain the most from our investments in sustainable transportation, we also need to reach out to people who live, work, and play in the areas served by those services/infrastructure and encourage them to use it.
Targeted marketing campaigns, or individualized marketing provide tailored outreach to educate people about their travel choices. This customized information allows each marketing program to focus on the unique travel needs of an individual neighbourhood, institution, or audience. It’s an effective way to bridge the information gap and support a change in travel behaviour — driving less and using alternative travel options more. In fact, it’s been shown to decrease the number of kilometers being traveled, especially when initiated alongside major transit service and/or infrastructure projects that make it easier to walk, bike, or bus.
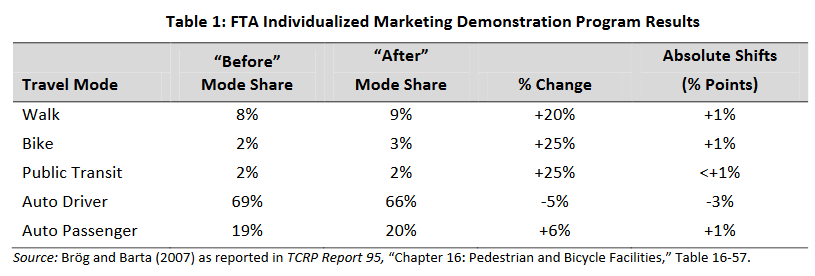
For instance, a Portland study showed that areas targeted for individualized marketing after installation of a new rapid transit line saw a near doubling in the shift to transit use compared to a similar area not targeted by individualized travel marketing.[1][2] Households near the rapid transit line that hadn’t been reached by Smart Trips, their individualized marketing program cut car use by 3 percent. But those Smart Trips did contact reduced car use by 12 percent.[3]
As SmartTrips program manager Linda Ginenthal points out in a 2014 BikePortland.org article, “It cost us a million dollars to do the SmartTrips program,” she said. “And we spent many, many millions of dollars on light rail and it got us a 3 percent reduction in trips. You do the math.”[4]
SmartTrips and TravelSmart projects have been shown to reduce drive-alone car trips by area residents within the SmartTrips service area 9% to 13%, with a corresponding increase in walking, bicycling, and transit mode shares
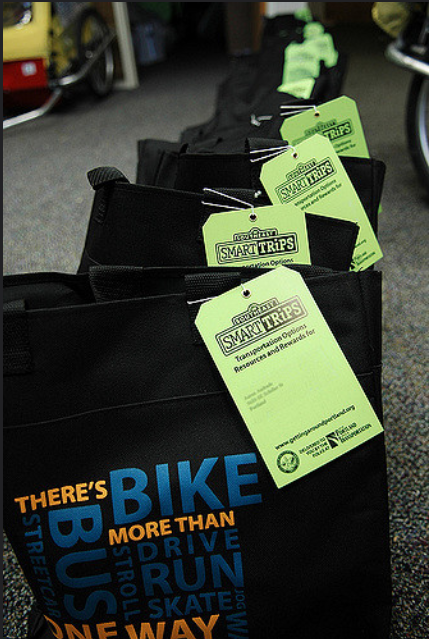
A Portland Smart Trips bag ready to go out in 2007.
The 2009 WinSmart Community Based Travel Marketing Pilot program (based on targeted/individualized marketing) showed that this type of program could be quite successful in Winnipeg. Results from the project showed an 11.7 per cent reduction in drive-alone and an 18.2 per cent reduction in trip-related CO2 emissions. This was supported by a 54.3 per cent relative increase in cycling, 3.4 per cent increase in walking and 8 per cent increase in carpooling. There was also a 5.4 per cent reduction in vehicle kilometres traveled (VKT).[5]
In Winnipeg, we are suggesting that the city launch an individualized marketing program that will reach 20,000 households per year, starting in 2020 with the opening of the Southwest Rapid Transit Corridor. Program planning would need to begin in 2019.
Footnotes
[1] Brög et al. as reported in TCRP Report 95. “Chapter 16: Pedestrian and Bicycle Facilities.” 2009. p. 16-220.
[2] Individualized Marketing Programs, Oregon Department of Transportation
[3] City’s ‘SmartTrips’ marketing program shifts focus, BikePortland.org, 2014
[4] City’s ‘SmartTrips’ marketing program shifts focus, BikePortland.org, 2014
[5] Section 7, WinSmart CBTM Project Report: WinSmart Community-Based Travel Marketing Pilot Project, Resource Conservation Manitoba, 2009
Continue and Expand Funding for BEST Program
Continue & Expand Funding for The W.R.E.N.C.H.
Provide Staffing Needed to Implement Pedestrian & Cycling Strategies
Mayor: Brian Bowman